
TheStreet
Disney stock is still stuck below resistance, even as its latest blockbuster hit, ‘Avatar: The Way of Water,’ is well-received.
Disney (DIS) – Get Free Report is trying to buck the early selling pressure on the first trading day of 2023.
Some other big names are taking it on the chin. Apple (AAPL) – Get Free Report shares are down more than 3.5% and making a new 52-week low, while Tesla TSLA is down 13%.
For Disney’s part the shares were up 1.6% at last check. The rally comes on reports of strong box-office results for “Avatar: The Way of Water.”
The film reportedly had a strong weekend: A Variety report said the film was nearing the $1.4 billion mark in global gross sales, approaching its break-even point.
The film crossed the $1 billion figure just 14 days after it was released, SeekingAlpha reported, making it the sixth movie to hit that figure within the two-week mark and the fastest to do so this year.
For what it’s worth, the first “Avatar” film is the all-time box-office leader, having grossed $2.92 billion. The sequel to that film, which is now in theaters, hit the $1 billion mark several days faster than the first.
That could bode well for Disney moving forward.
Trading Disney Stock
Daily chart of Disney stock.
Chart courtesy of TrendSpider.com
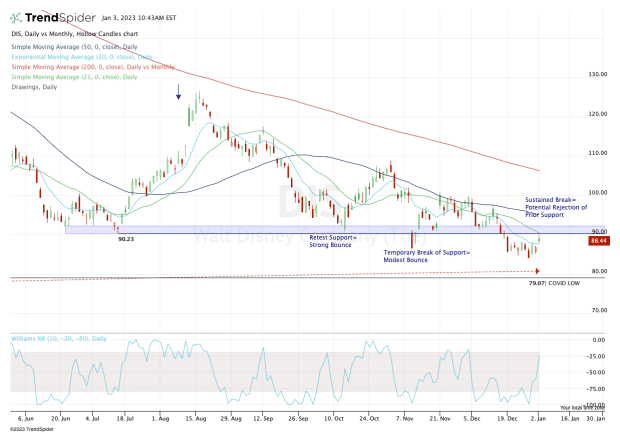
Above is a daily chart of Disney stock. We’ll also look at the monthly chart.
On the daily chart above, one can see that buyers clearly continued to step in around the $90 area. But the bounces became smaller over time.
In November, the stock broke below this area for two days, then rebounded and found resistance near $100. In that sense, it was not surprising to see Disney eventually break back below $90 last month and stay below it for several weeks.
Now the stock is trying to reclaim $90 and the 21-day moving average, and the bulls run the risk of prior support turning into current resistance.
If the stock is strong enough to reclaim these measures, it opens the door to the 50-day moving average, then the $100 level.
But if the $90 area is resistance, investors have to be on the lookout for lower prices.
Monthly chart of Disney stock.
Chart courtesy of TrendSpider.com
On the monthly chart I have a hard time ignoring the prospect of a move into the high-$70s. The 200-month moving average hasn’t been tested in more than a decade, but it last acted as strong support in 2011.
That combined with the lows from 2020 and October 2014 stand out as a potential opportunity in Disney stock, should it fall that far.
The bottom line is straightforward: See if Disney can reclaim $90 and the 21-day moving average. If it does not, keep an eye on the $78 to $80 area.
Author Profile
Latest entries
 ScienceSeptember 22, 2024Evolving artificial intelligence capabilities in space
 LifestyleSeptember 22, 2024Paris Auto Show 2024: A-Z Preview Of All Debuts
 ScienceSeptember 22, 2024Algorithm makes robots aware of careless human behavior
 HeadlinesSeptember 22, 2024Oktoberfest is open. The world’s largest folk festival all things beer begins after ceremonial keg-tapping